title: "Cookbook" sidebar_position: 5
Cookbook
Short worked examples. Pipelines that end in sheet or sheet view
run in a nushell session, with 012's module installed (Install the
sheet command); lines that start
with a name and = are code cells of a notebook
(sheet nu, or Data > Shell > Open notebook in any workbook), one
cell a line, each run with Shift+Enter. Nushell's own
cookbook has more pipelines to start
from.
A CSV cleaned, then summarized
Money written as text ("$2,252.50") becomes numbers in nushell, and a
second cell totals it by region, sent to a sheet with a chart that
follows it.
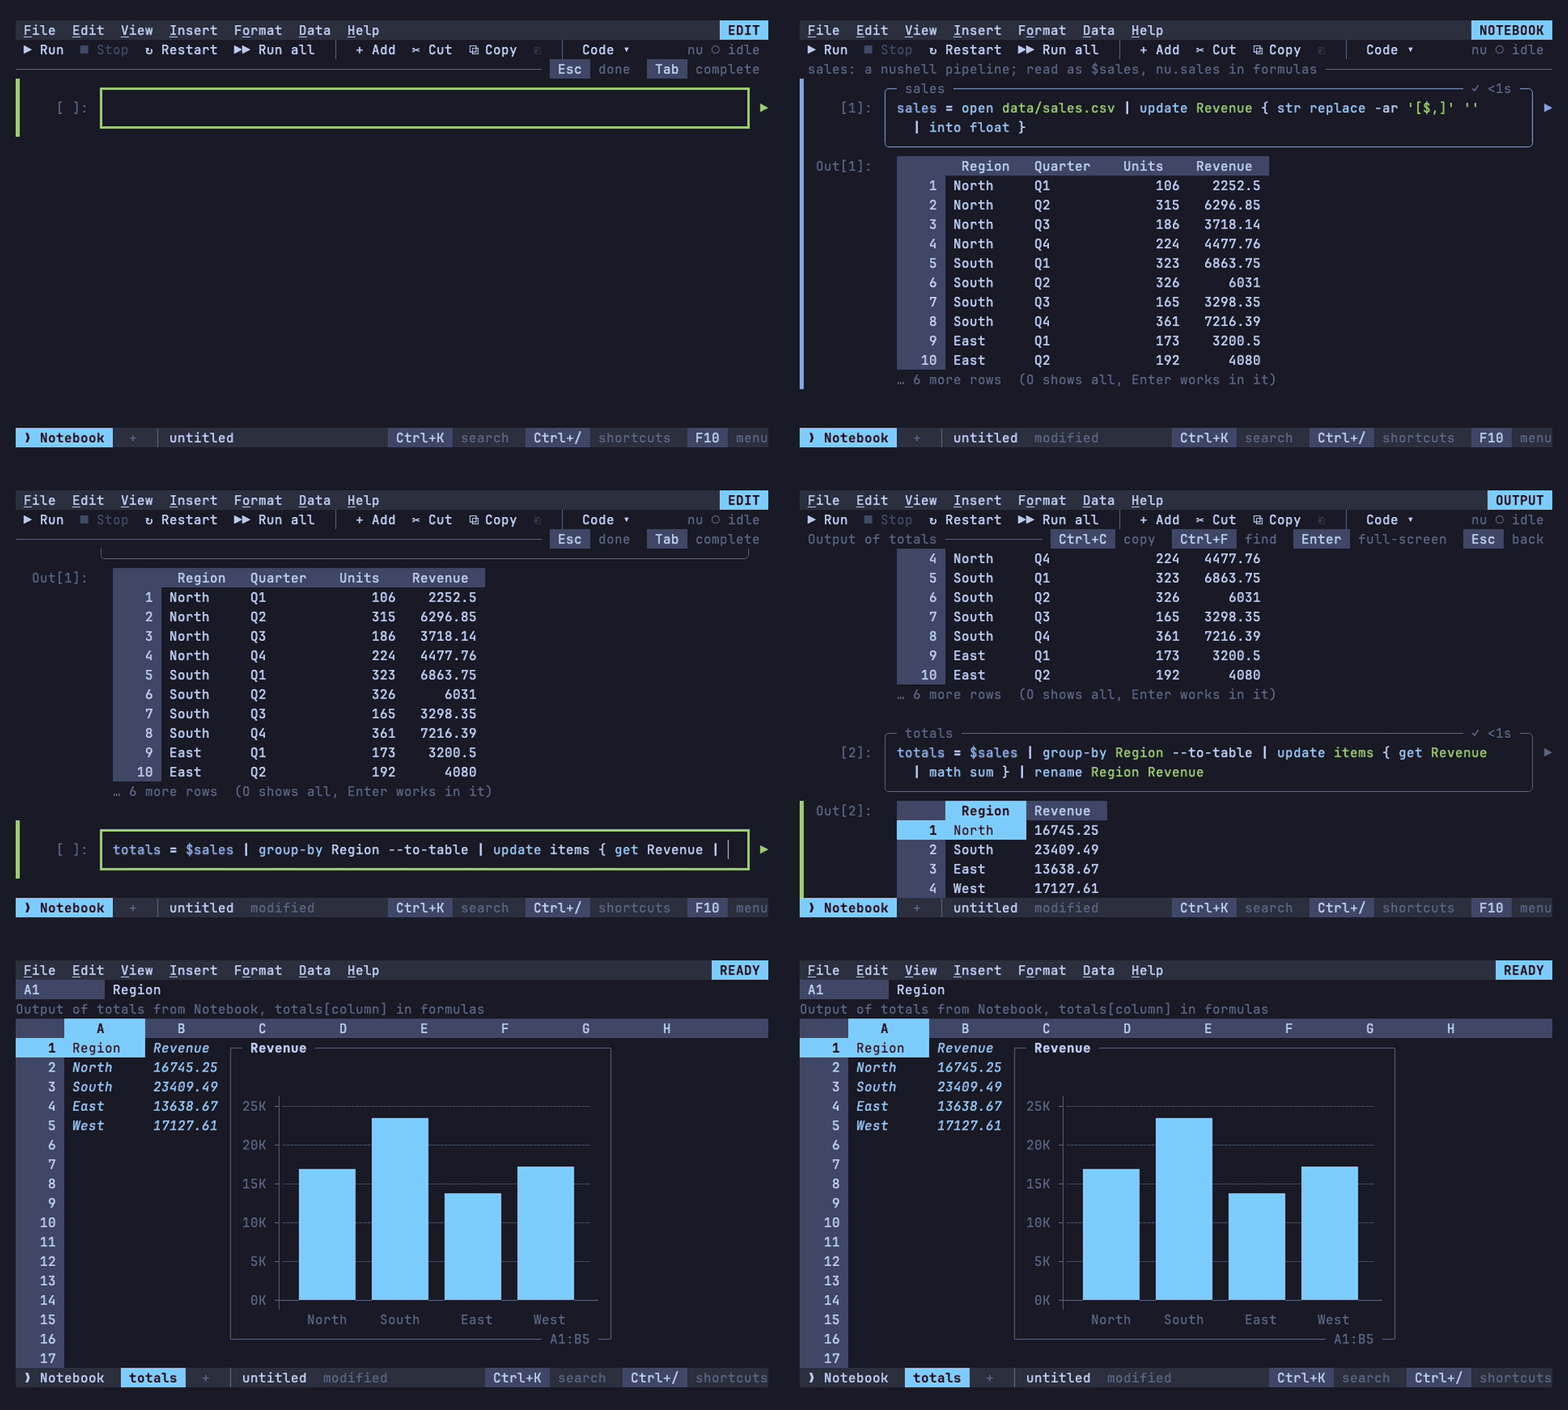
sales = open sales.csv | update Revenue { str replace -ar '[$,]' '' | into float }
totals = $sales | group-by Region --to-table | update items { get Revenue | math sum } | rename Region Revenue
To chart it, Enter on totals's output, then Insert > Chart: the
output goes to a new sheet named totals and the chart goes beside it
(Outputs as grids). Edit sales to
read another file and run it: totals shows stale until it runs too
(at once in a reactive notebook),
and then the sheet and the chart follow.
To pivot rather than total, send sales to a sheet and Data > Pivot
table there (Pivot tables): Region in rows,
Quarter in columns, Revenue in values.
Nushell:
update,
str replace,
into float,
group-by,
math sum.
A log file followed live
A JSON lines log (app.jsonl) linked with Data > Linked file > Link a
table takes in rows as they're written (Following
files). A notebook's cells read it as $app:
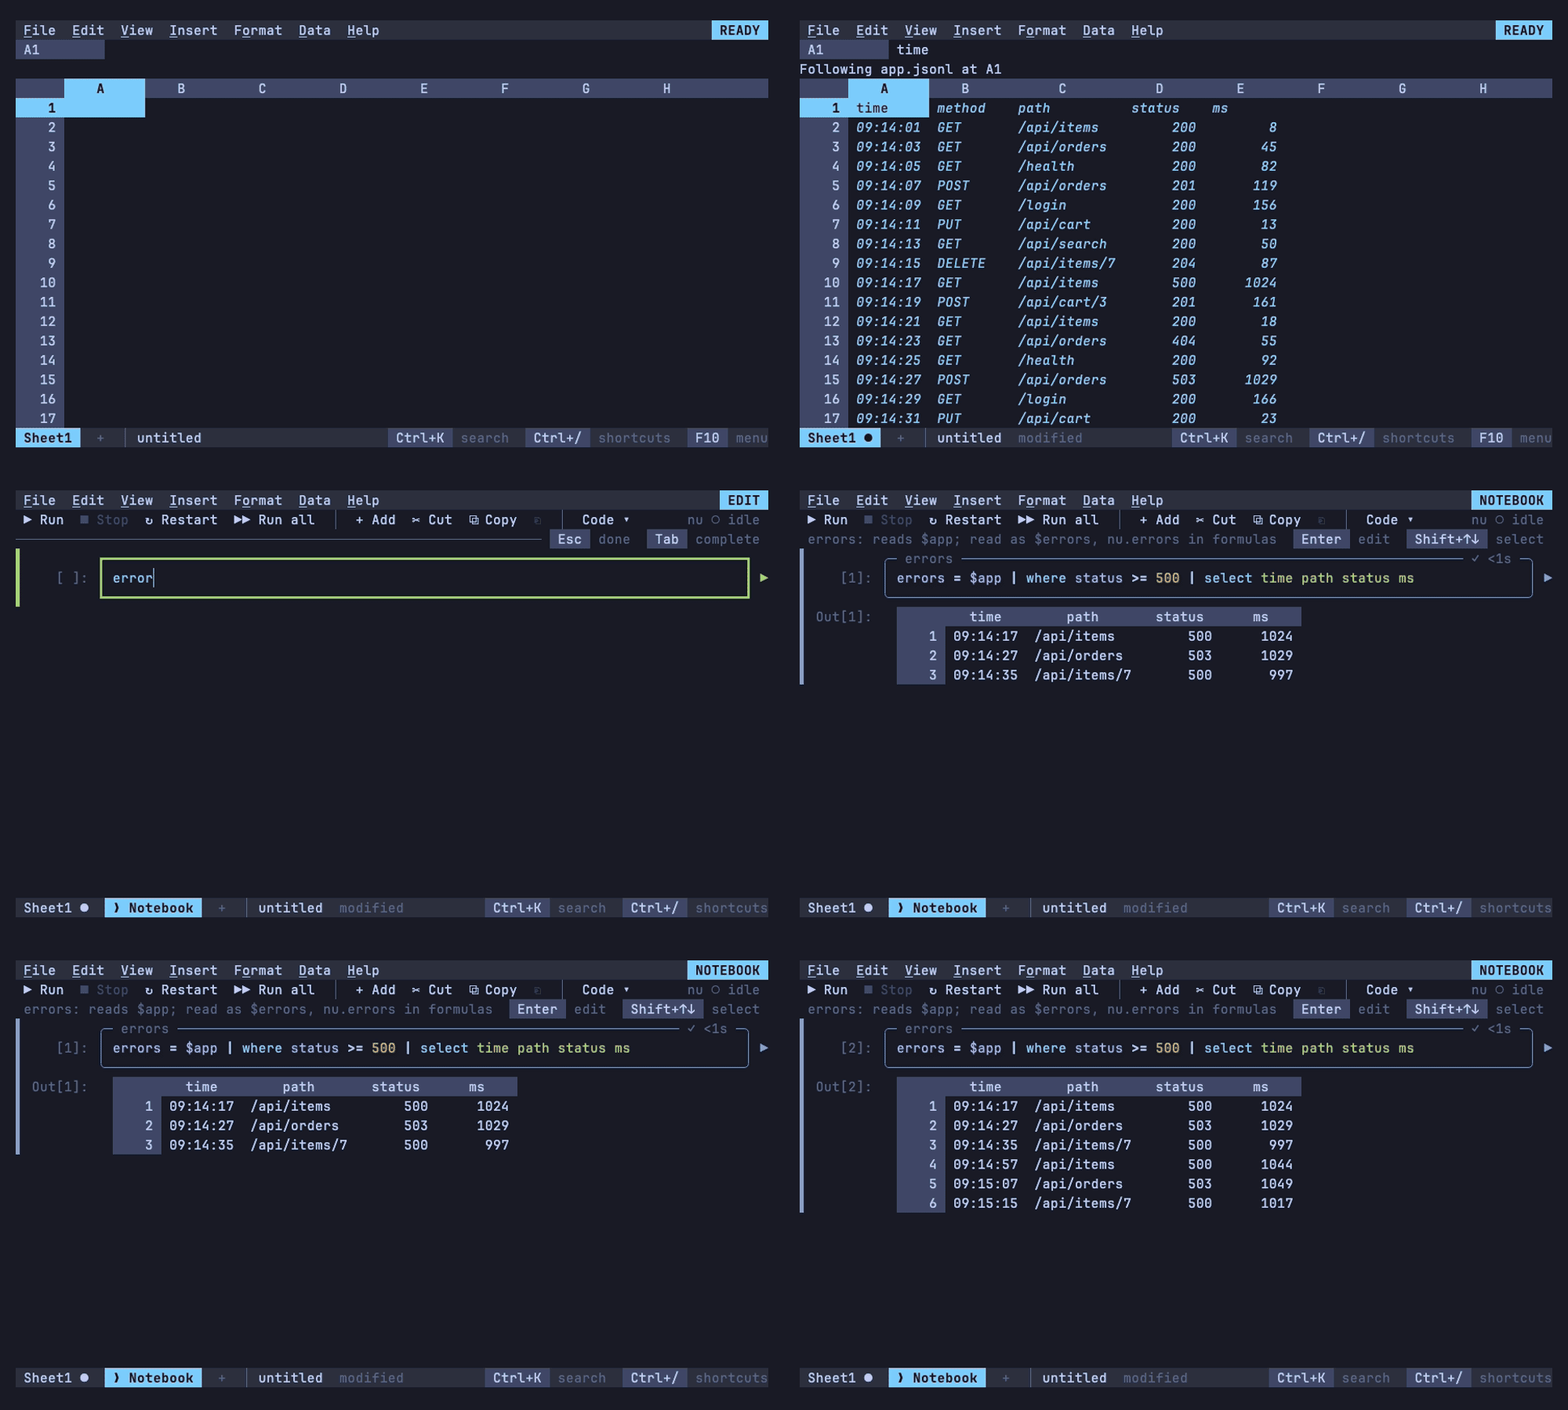
errors = $app | where status >= 500 | select time path status ms
by_path = $errors | group-by path --to-table | update items { length } | rename path errors
The linked region grows by itself; running errors again (Ctrl+Enter)
reads the rows the log has now, and a reactive notebook runs by_path
after it. A log in CSV or TSV works the same; a plain text log needs a
line of nushell to become a table, such as
parse in a cell:
lines = open --raw app.log | lines | parse "{time} {level} {message}"
Disk usage with a chart
usage = du * | select path physical | update path { path basename } | sort-by physical --reverse
Sizes arrive in the Size format (Types), so once G sends
the output to a sheet, a chart's axis and =SUM(nu.usage) read them as
bytes: Insert > Chart there for a column chart. Ctrl+Enter on the
cell runs du again, and the sheet follows.
Nushell: du.
An API response as a table
http get https://api.github.com/repos/nushell/nushell/issues | select number title user.login comments created_at | update created_at { into datetime } | sheet view
Sort by comments, filter by author, or make a pivot table of issues by
author, in the sheet. In a notebook, the same pipeline without
| sheet view is a cell that fetches the list again each time it runs;
Enter on its output works in it as a grid, to sort, filter and chart, and
nu-timeout stops a request that hangs.
Nushell: http get,
into datetime,
and the cookbook's HTTP
page.
Processes, sorted, filtered and sent back
ps | where cpu > 1 | sort-by cpu --reverse | select pid name cpu mem | sheet | get pid | each {|pid| kill $pid }
In 012, sort the list and filter it down to the processes to stop (Data > Create a filter); Ctrl+Q, Enter sends the rows the filter shows, and nushell stops those and no others. D sends nothing, and the pipeline stops there (The exit status).
Git history as a sheet
commits = git log --pretty=%h»¦«%an»¦«%s»¦«%aI -n 500 | lines | split column "»¦«" commit author subject date | update date { into datetime }
authors = $commits | group-by author --to-table | update items { length } | rename author commits | sort-by commits --reverse
date is a datetime, so a filter by date or a pivot table by month
works on it in the sheet. The pattern is the one nushell's cookbook
explains in Parsing git
log.
A workbook read and written from a script
012 get and 012 set work on a workbook file
without the screen, so a nushell script can read a range with its types,
compute, and write results back:
let sales = ^012 get budget.012 'Q3!A1:C40' --format nuon | from nuon
let total = $sales | where region == West | get amount | math sum
^012 set budget.012 'Summary!B2' ($total | into string) 'Summary!B3' (date now | format date '%Y-%m-%d')
^012 recalc budget.012
012 recalc exits 1 when a formula shows an error, so a script stops
there. What changed between two versions comes back as a table too:
^012 diff last-week.012 budget.012 --format nuon | from nuon | where field == value