title: "Pivot tables" sidebar_position: 8
Pivot tables
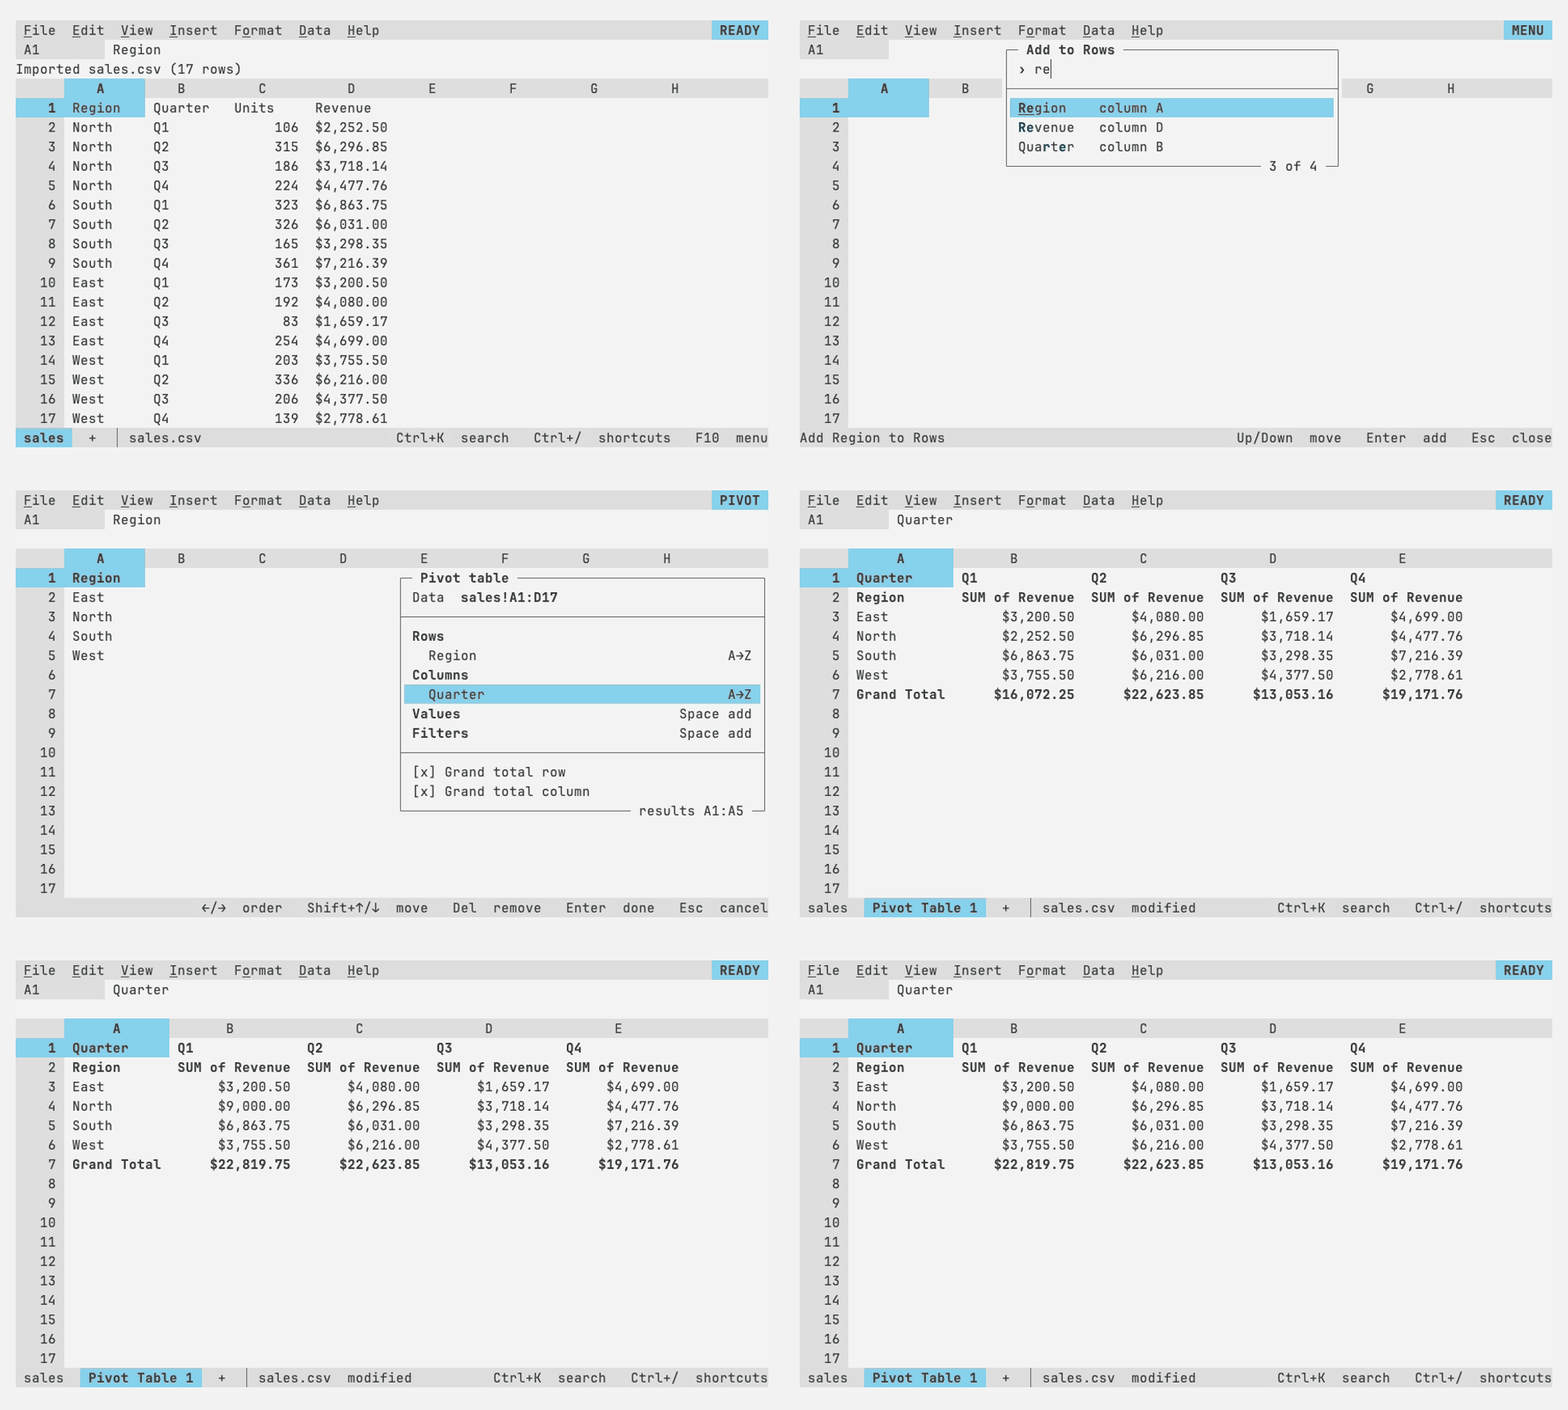
Data > Pivot table summarizes the selection, or the table around the
active cell, on a new sheet named Pivot Table 1, as Sheets' Insert >
Pivot table does. The data's first row names the fields. The pivot editor
opens docked at the right of the grid, with the results updating behind it:
- Rows group the data by a field's values, one row per value; with two or more, the groups nest and each outer group gets a subtotal row.
- Columns spread the groups across columns by a field's values; with
two or more, each outer group gets a subtotal column (
East Total) after its last column. - Values summarize a field for each group: SUM, COUNTA, COUNT,
COUNTUNIQUE, AVERAGE, MAX or MIN (Sheets' "Summarize by"), shown as they
are or as a share of their row, column or grand total ("Show as").
A new value is summed when its field holds numbers, and counted
otherwise. Its header is Sheets'
SUM of Unitsuntil you rename it. - Filters leave out rows by a field's values or a condition, in the same picker as a filter's column.
- Grand total row and Grand total column add Sheets' totals, and turn the subtotal rows and columns on and off with them.
Up and Down pick a line. Space adds a field to the section it's on (pick it from the fields of the data, type to narrow the list), opens a filter's values, or flips a toggle; Space on the data range points at a new one on its sheet. On a row or column field, Left and Right order its groups A to Z, Z to A, or by a value's total, smallest or largest first, and Shift+Up and Shift+Down move it before or after the others, which changes how the groups nest. On a value, Left and Right change how it's summarized, S how it's shown, and R (or F2) renames it on the context line, the name heading its columns; an empty name goes back to Sheets'. A value keeps its name when its summary changes. Del removes a field. Every change is an undo step; Enter keeps them, Esc undoes them, and removes a pivot just created. Data > Edit pivot table opens the editor again.
Groups follow Sheets: text ignoring case (east joins East), numbers
and dates by value, with the source's format, so dates show as dates.
Numbers and text never share a group: 1 and the text '1 are two.
Groups sort numbers first, then text, booleans and errors, and blank
cells last; as in Sheets, the group of blank cells has a blank label,
and its subtotal is just Total. Sorting an outer column field by a
value's total orders whole outer groups, so their columns stay
together. Rows blank across the whole range are
left out, so a range can reach past the data. SUM, AVERAGE, MIN and MAX
keep the column's number format: the column's own when it has one, else
the format most of its numbers show in (ties go to the first), so one
price typed as $9,000 among $2.50s doesn't turn every total into
whole dollars. A group's label shows in the format of its first cell. An
error in a summed column shows as that error, as SUM would.
The results are live: any change to the data, typed, pasted, filled or
computed by a formula, recomputes the pivot, and rows or columns inserted
inside the range widen it. Formulas can read the results (='Pivot Table 1'!B5), and copying them pastes their values. The results themselves
can't be edited, as in Sheets: typing, pasting, clearing, formatting,
sorting or inserting rows or columns over them is refused with a note on
the context line. A pivot shows #REF! in A1, explained on the context
line, when its data's sheet is deleted or when its results would
overwrite a cell typed next to them; undo or moving the cell brings it
back. The sheet's columns widen to fit the results until you set a width
yourself.
Frequency tables
Data > Frequency table (column stats), or Alt+Shift+F (VisiData's
Shift+F; plain Shift+F types an F), counts each value of the active
column of the table around the active cell on a new sheet, Frequency of <field>: the value, how many rows have it and their percentage, most
frequent first, with a Grand Total. Blank cells are counted too. It is a
pivot table like any other, so it stays live, and the pivot editor
changes it.