title: "Charts" sidebar_position: 10
Charts
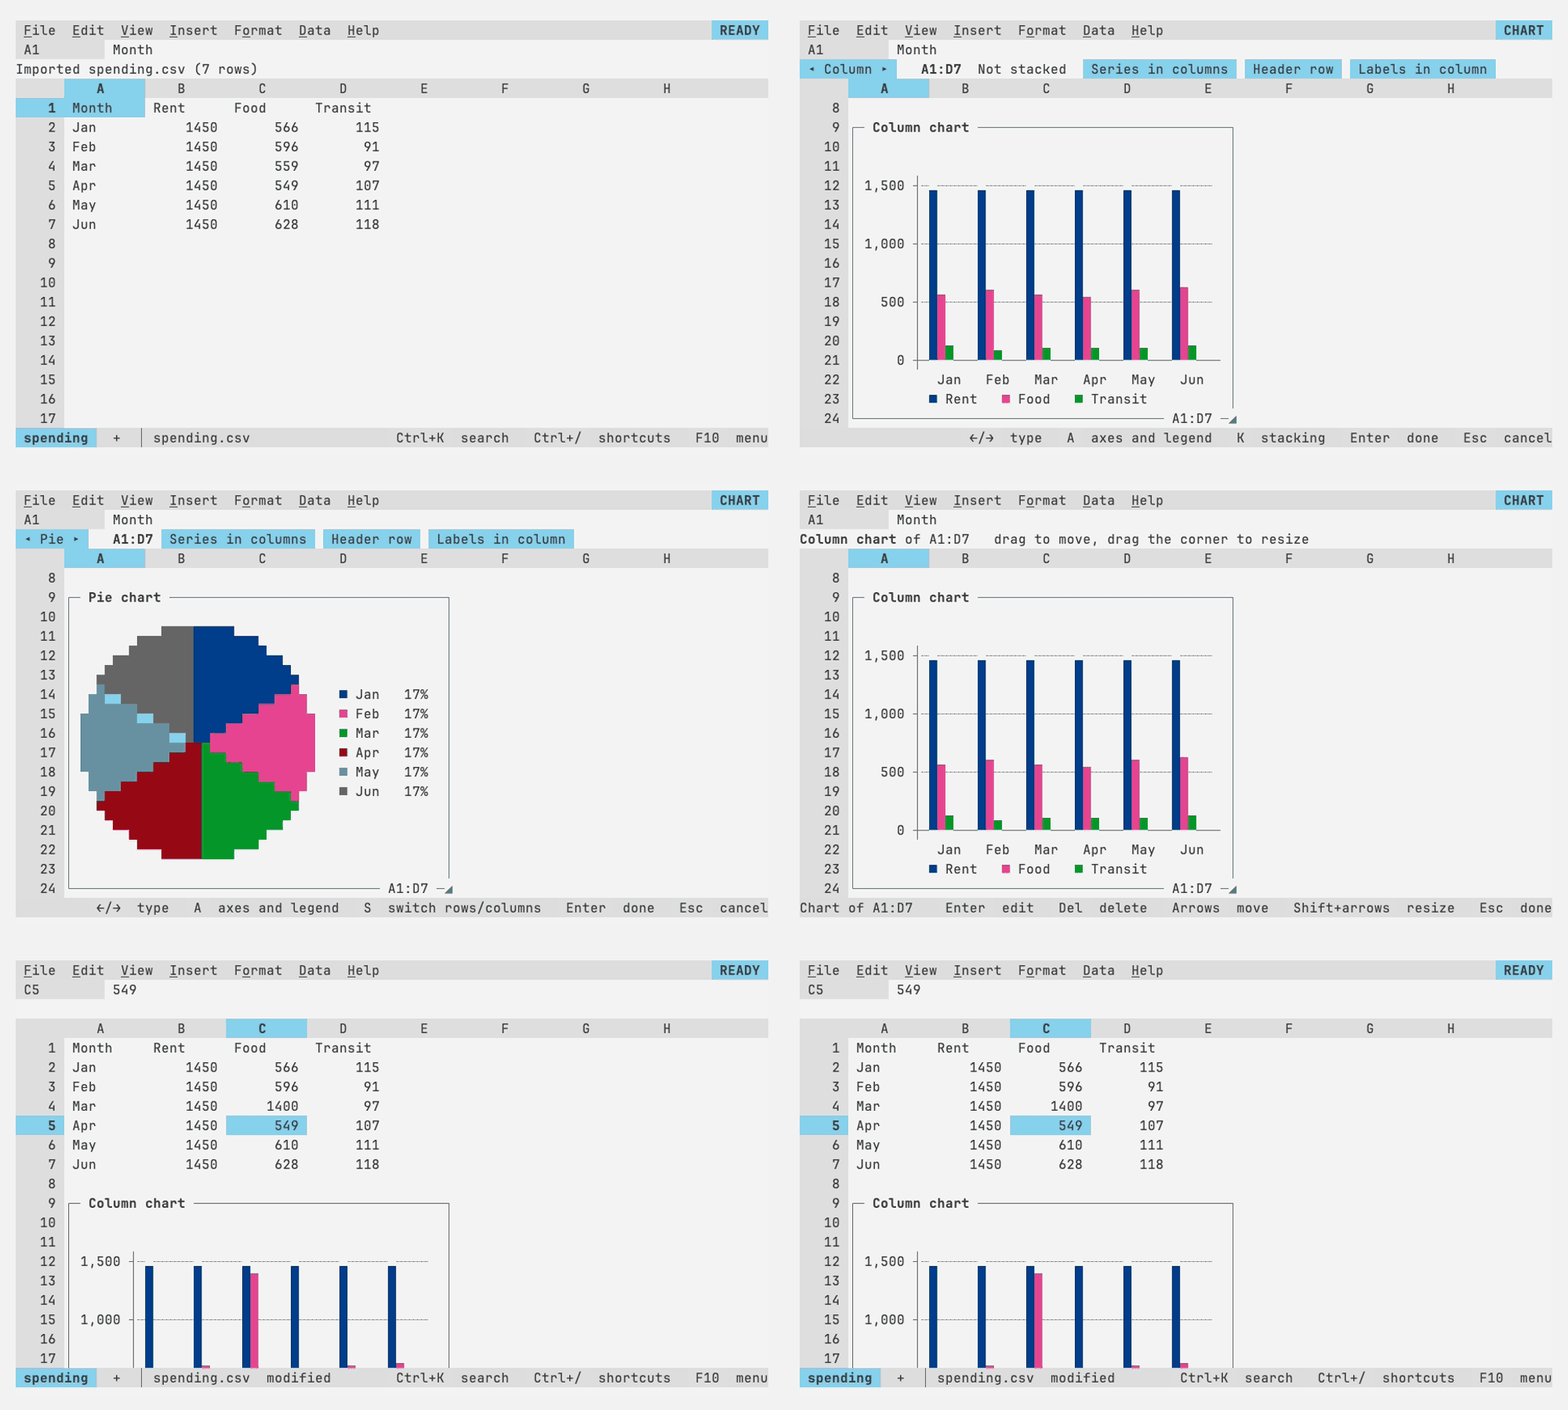
Insert > Chart charts the selection, or the table around the active cell, guessing the header row, the label column and a title. The chart floats over the grid, pinned to a cell, and redraws when its data changes.
The chart editor is a bar on the context line: Left/Right (or 1 to 6) picks column, bar, line, pie, area or scatter; S switches series between rows and columns; H and L toggle the header row and labels; R points at a new range; T edits the title. Enter keeps the changes, Esc undoes them.
| Type | Draws |
|---|---|
| Column, Bar | a bar per series in each category; K cycles Not stacked, Stacked and 100% stacked |
| Line | a line per series |
| Area | a line per series filled down to the axis, the smaller series in front; K stacks them as columns do |
| Pie | the first series as slices, with each slice's share |
| Scatter | the first series as X and every other one as Y against it, as in Sheets (with one series, the labels are X when they're numbers); E adds a linear trend line per series |
A opens a second bar, as Sheets' Customize tab: N and X type the value axis' minimum and maximum (a number as a cell takes one, blank for automatic; values past a fixed end stop at it), L puts it on a log scale (values that aren't positive are left out, and its ends round out to powers of ten), G turns the gridlines off and on, and P moves the legend between the bottom, the right and none. A legend lists two series or more, and a pie's legend of slices always sits on its right. Enter or Esc goes back to the first bar, keeping the changes. On the value axis of a bar chart these options apply along the bottom; on a scatter, to Y.
Click a chart to select it. Drag it to move it, drag its corner to resize it, or use the arrows and Shift+arrows; Enter edits it, Del deletes it, and right-click offers both. In terminals that say when a key is let go (Keys the terminal has to tell apart), holding Space on a selected chart shows it across the grid until Space is let go. Charts follow inserted and deleted rows and columns, and save with the sheet.
Images or text. At startup 012 asks the terminal whether it supports the
kitty graphics protocol. Where it does (kitty, Ghostty, WezTerm) the plot is
a real image, drawn in the terminal's own palette and placed with Unicode
placeholders, so redraws never erase it. Otherwise, where the terminal
lists sixel graphics among its device attributes (foot, xterm, mlterm,
Windows Terminal, and terminals built on xterm.js with its image addon
on, such as VS Code with terminal.integrated.enableImages), the plot is
a sixel image in the terminal's palette, in as many colors as it has
color registers. A sixel image is drawn over the finished screen, on top
of the text chart, which it covers whole: a terminal that lists sixel but
doesn't show the image shows the text chart. The
image shows only where its whole plot area does: a chart scrolled partly
out of the grid, or under another chart, a menu or a dialog, is text
until it shows whole again, and the image is drawn again after
scrolling, resizing or an edit to its data. Elsewhere, and inside tmux,
the plot is drawn with block and braille characters. Axis labels, the
legend and the frame are text either way.