title: "Linked sources" sidebar_position: 8
Linked sources
A Parquet file, or a SQLite table or query, too big for any grid links as a source: a read-only table on a tab of its own, read in place rather than imported. The tab shows a window of the rows as it scrolls, with the row numbers and the scrollbar over every row, and formulas and pivot tables read the whole source by streaming it. A source of ten million rows opens at once and takes a few MB.
Linking a source
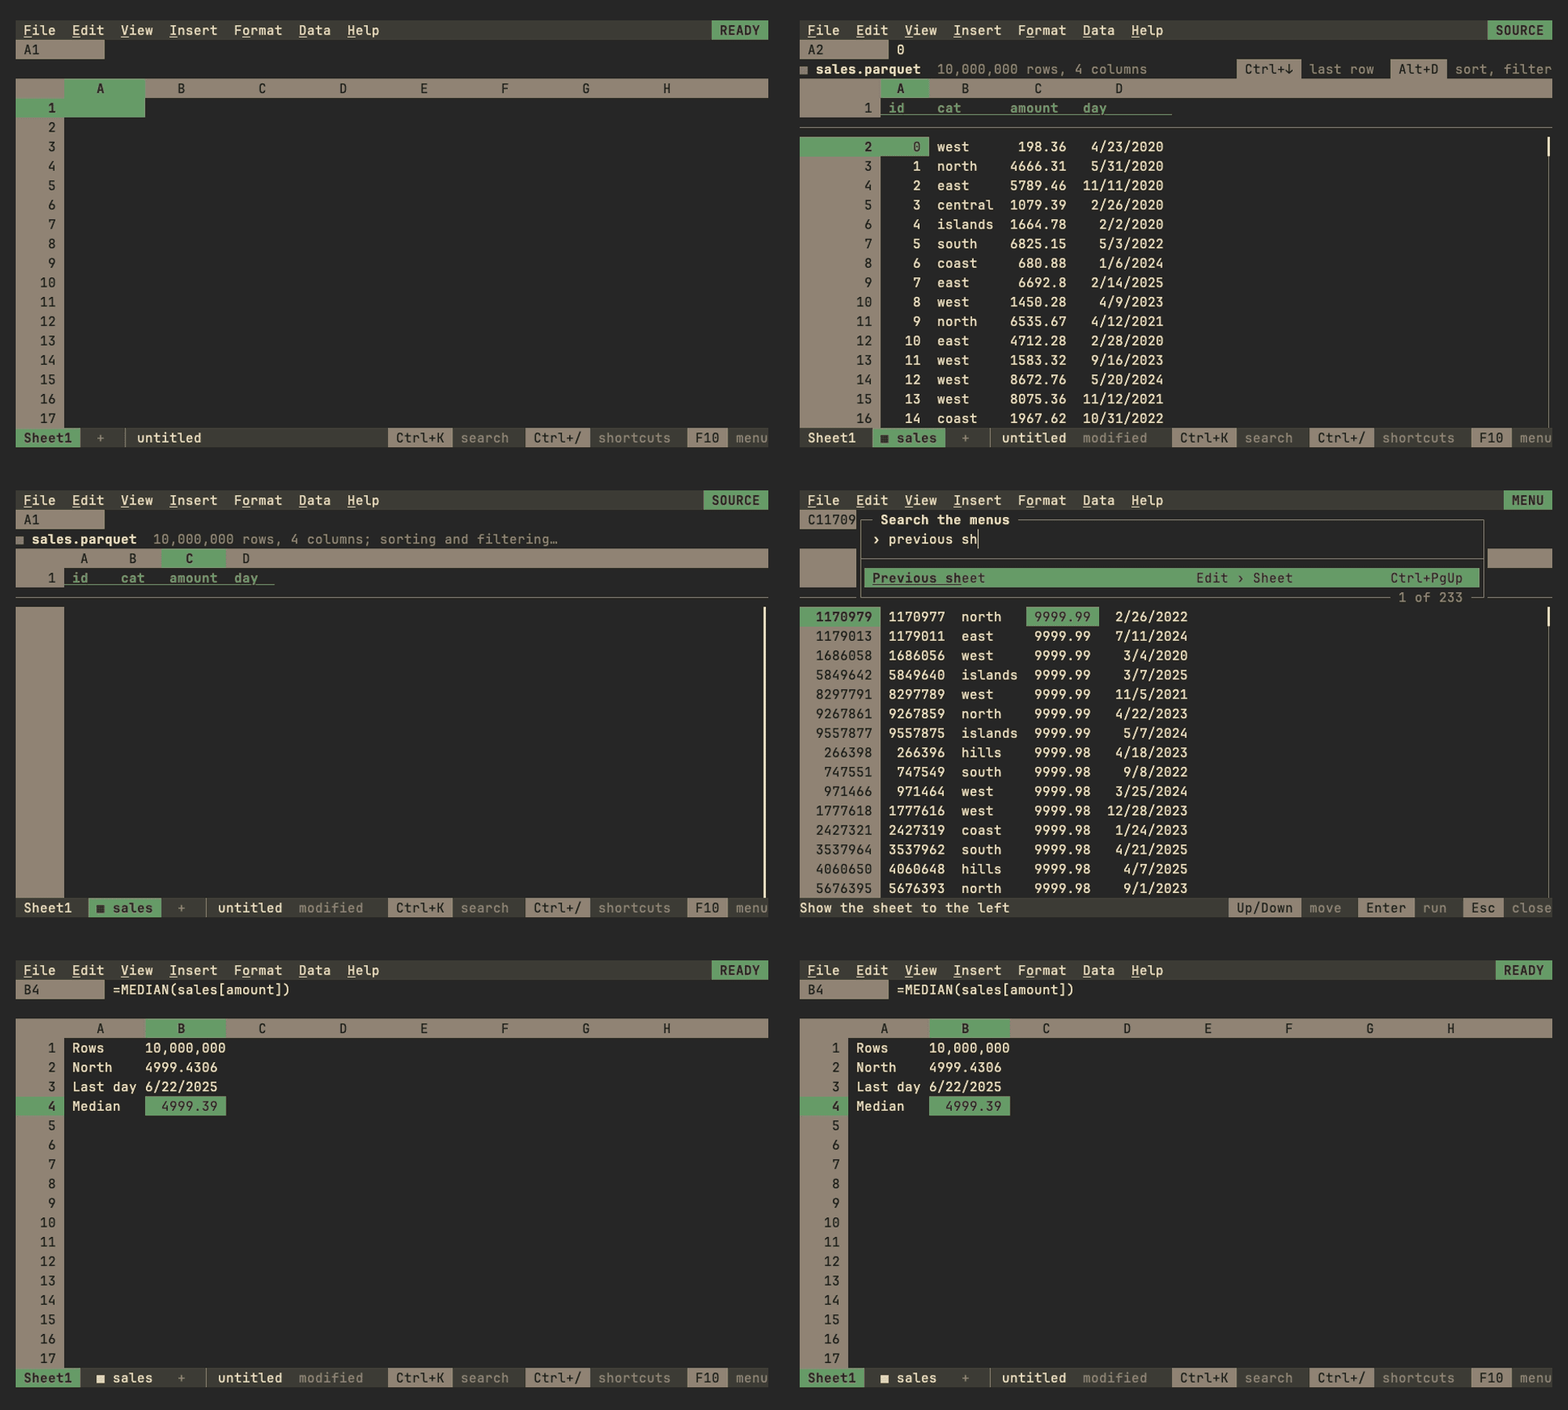
Data > Linked file > Link a source lists the Parquet files and
SQLite databases in the folder, or takes a path. For a database a
second list asks which table or view to read, or A query… to read
what a SELECT returns.
The source gets a tab after the one shown, named after the file
(sales for sales.parquet), with ▦ before its name. The source is
a table of that name, which formulas on any sheet
read as a table's:
| Formula | Reads |
|---|---|
=SUM(sales[amount]) |
a column's values, every row |
=ROWS(sales) |
the rows under the header |
=COUNTA(nu.sales) |
the whole table, header row included |
=sales!C5 |
one cell: row 1 is the header, so row 5 is the source's fourth row |
Renaming the tab keeps the table's name. Undo takes the link back. A
source's rows may run past the grid's last row, 1,048,576: its table's
name reaches them all, where a reference typed as C5 stops at the
grid's edge.
The tab
Row 1 is the header, the columns' names, and stays put as the rows
scroll under it. The rows are numbered as the tab's rows, so the
source's first row is row 2, and sales!C2 is its first amount. The
scrollbar at the right edge is as long as the share of the rows shown,
and as far down as they are.
| Key or mouse | Does |
|---|---|
| Arrows, Tab | Move the active cell |
| Page Up, Page Down, the wheel | Scroll |
| Home, End | The first or last column |
| Ctrl+Up, Ctrl+Down | The first or last row |
| Ctrl+Home, Ctrl+End | The first cell, the last |
| A click on the scrollbar, or dragging its thumb | Jumps there |
| Ctrl+G, F5 | Goes to a row, or a cell such as C5000000 |
| Ctrl+C | Copies the active cell |
The rows come from the file a page (128 rows) at a time, in the
background, the pages either side of the window read ahead, so
scrolling finds them there. A row on its way shows …. The name box
shows the active cell as the tab names it, and the formula bar its
value; the context line says what the source is:
▦ sales.parquet 10,000,000 rows, 4 columns. The mode is SOURCE,
and typing, pasting or formatting there says the tab is read-only.
Sorting and filtering
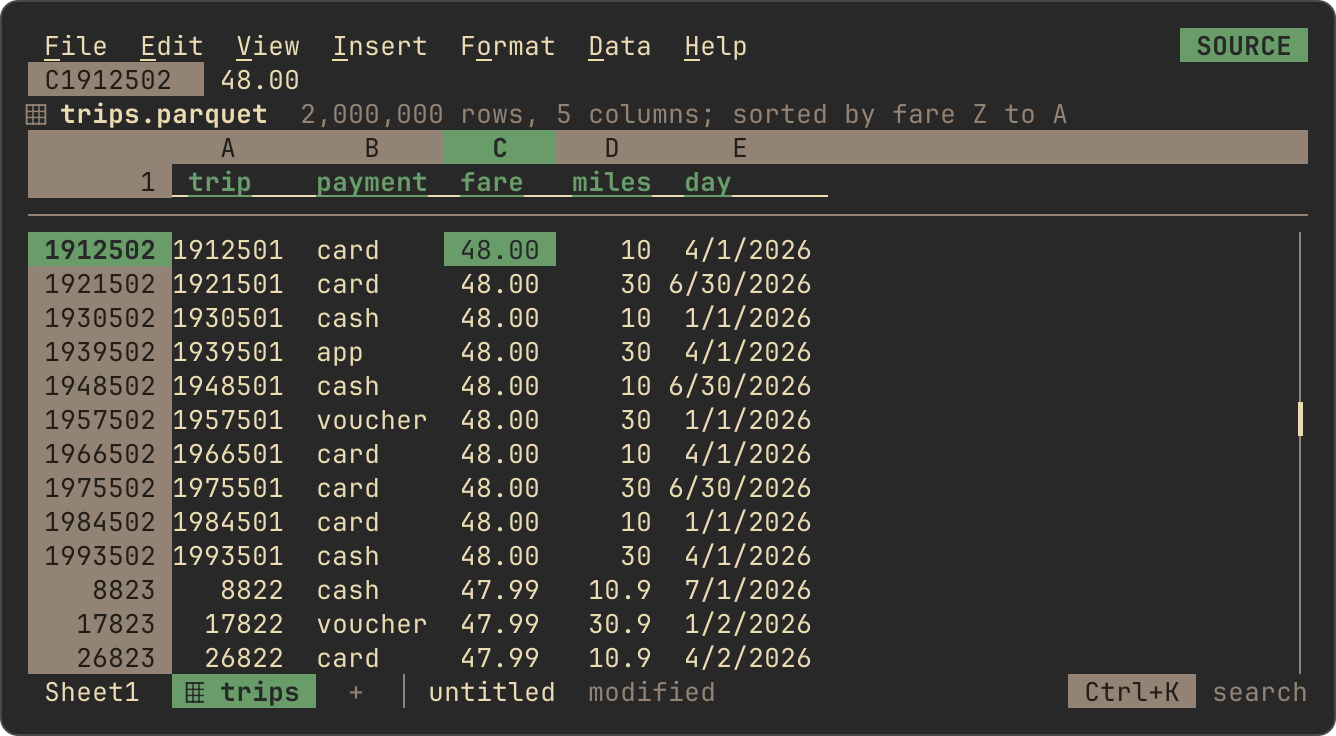
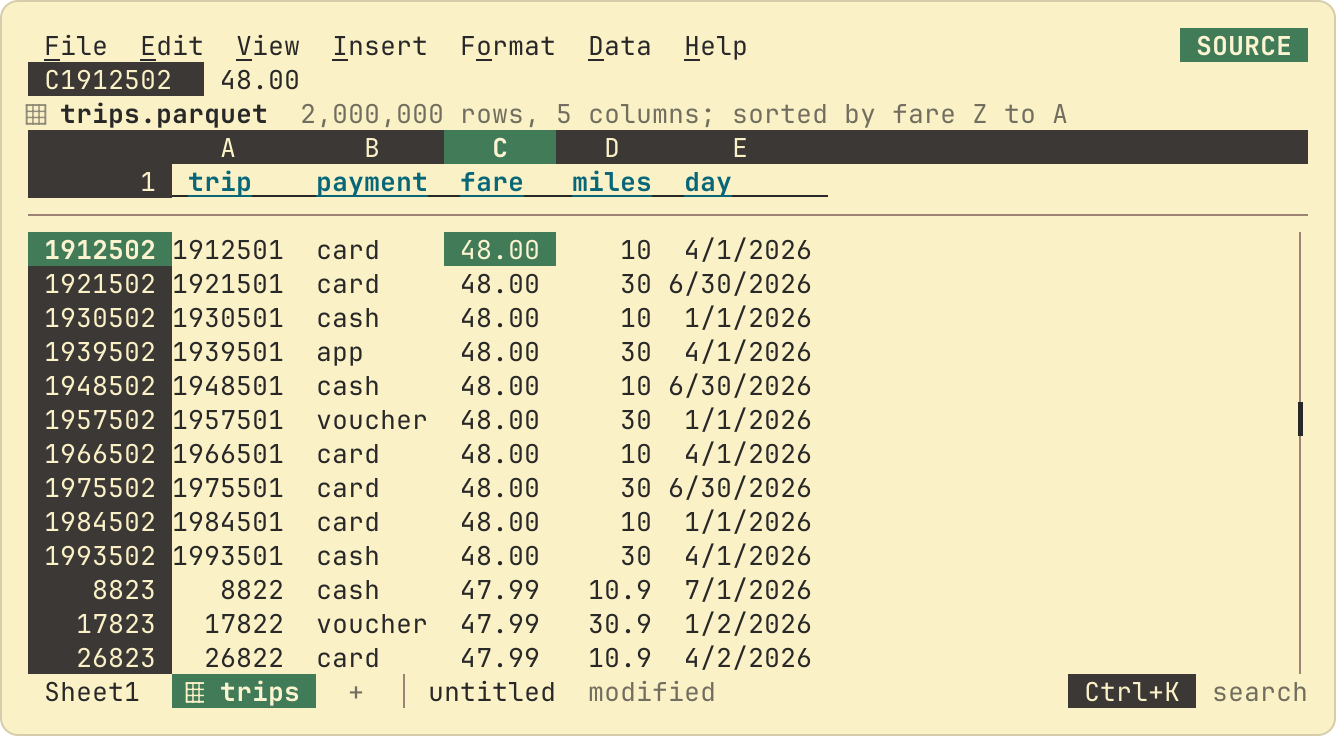
The tab's rows sort and filter as a sheet's do, without changing the file:
- Data > Sort sheet A to Z (or Z to A) sorts by the active column; blanks go last either way.
- Data > Create a filter or Filter by column asks for a condition on the active column: the conditions of a sheet's filter. There is no list of values to tick: a source's are too many to list. Each column's condition applies at once.
- Data > Remove filter drops the conditions, and Data > Linked file > Original order shows the source's own rows in its own order.
Each is an undo step and is saved with the workbook. Formulas read the source in its own order, every row, as formulas read the rows a sheet's filter hides.
Ordering reads the whole source once, in the background, while the
context line says sorting and filtering…; the tab then shows the
first of the rows. SQLite does the work: the sort and the conditions
become SQL, the rows' order is kept in a temporary database beside the
system's temporary files, and the database itself is never written. A
Parquet file is streamed: a filter is one pass over the columns it
tests, and a sort writes sorted runs to temporary files and merges
them, so memory stays a few MB and up to about 100 MB while sorting,
whatever the size. Either way a page anywhere in the ordered rows
costs what one at the top does:
In SQLite a text condition compares the text as SQLite writes it, so a
number reads as 1e+20 where the sheet shows 1E+20, a date held as
text (2026-09-26) sorts and compares as that text, and letters beyond
ASCII are compared by case.
Formulas over a source
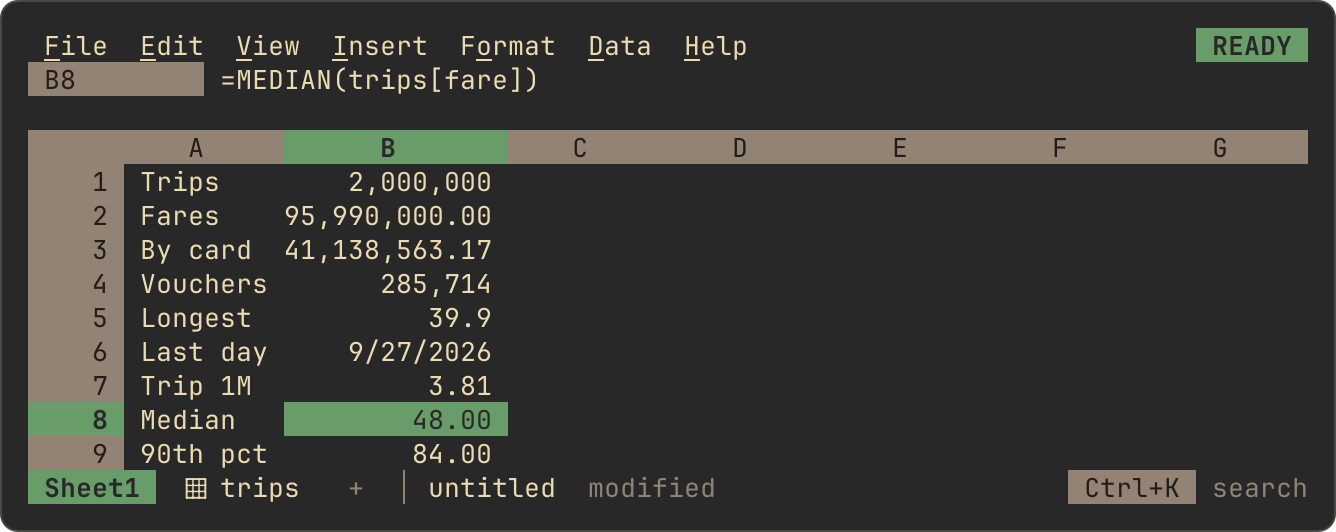
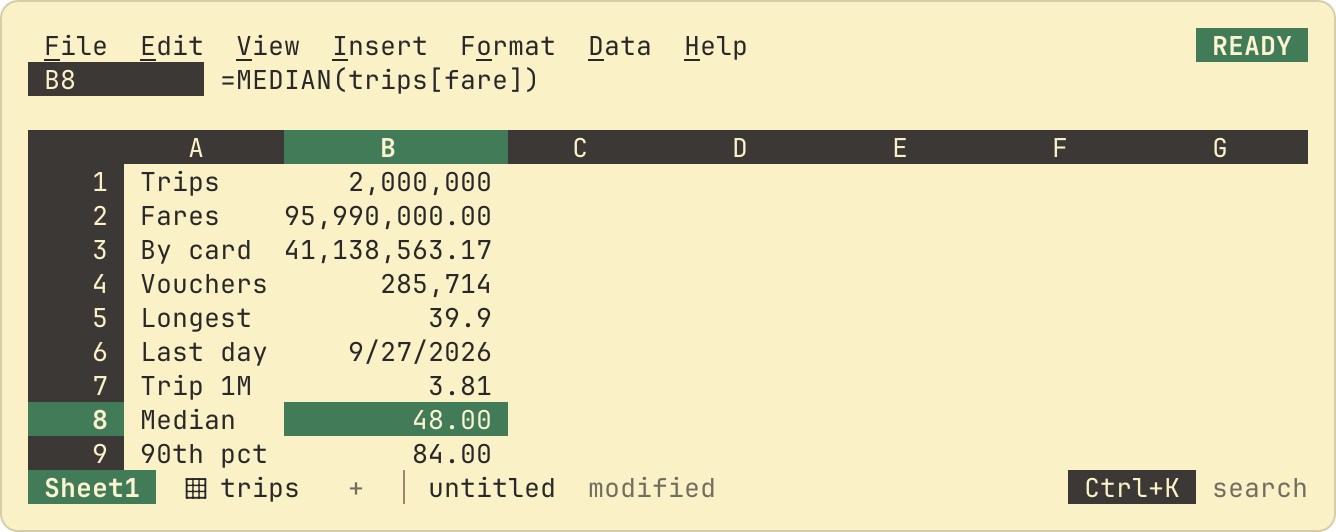
A function given a source's range is worked out in the background, by
reading the source; its cell shows Loading… until then. The answer
is kept until the file changes, so another formula asking the same, or
the same formula recalculating, costs nothing.
These read a source of any size, holding only what they compute:
| Kind | Functions |
|---|---|
| Aggregates | SUM, AVERAGE, COUNT, COUNTA, MIN, MAX, PRODUCT |
| Criteria | COUNTIF, COUNTIFS, SUMIF, SUMIFS, AVERAGEIF, AVERAGEIFS, COUNTBLANK, SUMPRODUCT |
| Lookups | MATCH, XLOOKUP, VLOOKUP, HLOOKUP, INDEX, ROWS, COLUMNS |
| Ranks | RANK, RANK.EQ |
| Order statistics of one range | MEDIAN, PERCENTILE, PERCENTILE.INC, PERCENTILE.EXC, QUARTILE, QUARTILE.INC, QUARTILE.EXC, LARGE, SMALL, MODE, MODE.SNGL |
The first four read the source once. An order statistic sorts the
range's numbers on disk, beside the system's temporary files, and
reads them back in order once: a MEDIAN of ten million rows takes
about two seconds, 50 MB of memory and 160 MB of disk while it runs
(Bounds of support). Its
range is one argument, its others single values:
MEDIAN(sales[amount]) and PERCENTILE(sales[amount],0.9) stream,
where MEDIAN(sales[amount],sales[tax]) holds what it reads.
A result keeps what its column means, as a formula over a sheet takes
its inputs' format: SUM, AVERAGE, MIN, MAX and the lookups show in the
format the column's type gives it. In Parquet that's a DECIMAL with
its scale's decimals, a DATE as a date, a TIMESTAMP as a date and
time, a TIME as a time and an INTERVAL as a duration; in SQLite the
declared type: DATE, DATETIME or TIMESTAMP, TIME, DECIMAL(10,2) or
NUMERIC(10,2) with its decimals, and MONEY as currency. A count over a
source (COUNT, COUNTA, COUNTIF, COUNTIFS, COUNTBLANK, ROWS, COLUMNS)
shows as a whole number with the locale's thousands separators:
2,000,000. A format given to the cell wins over either.
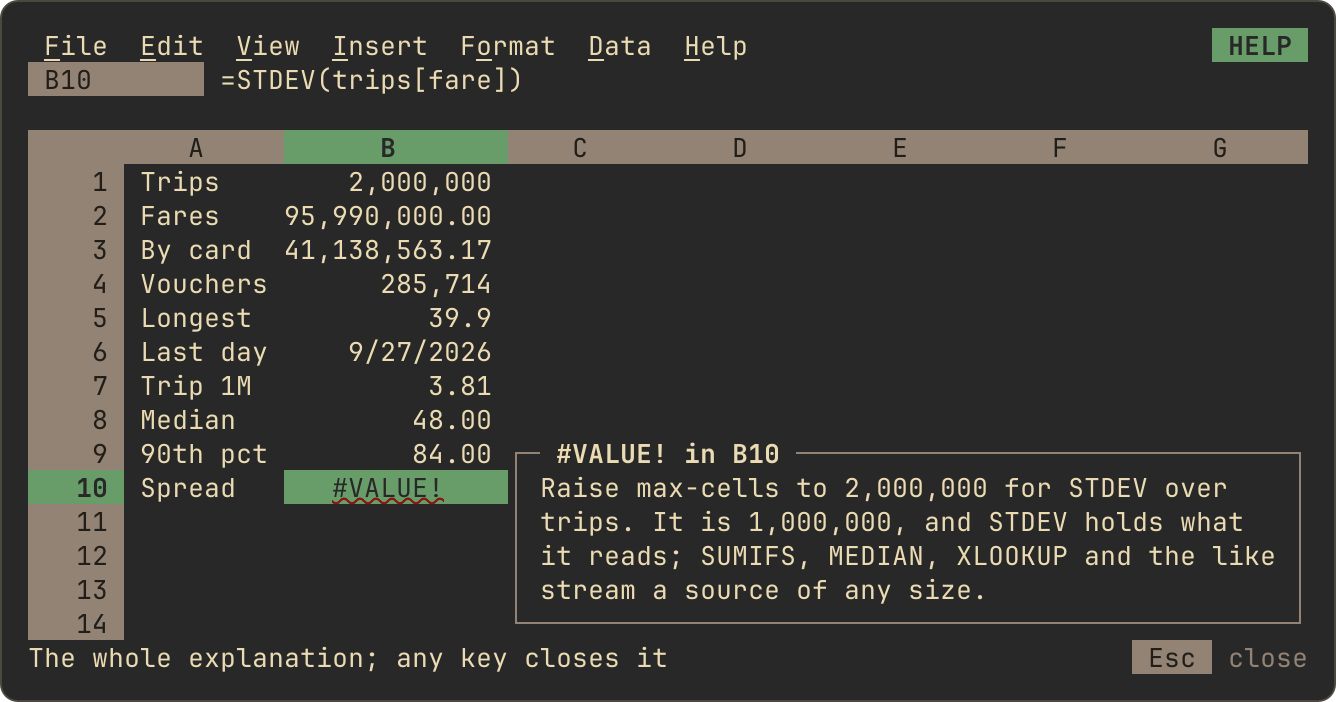
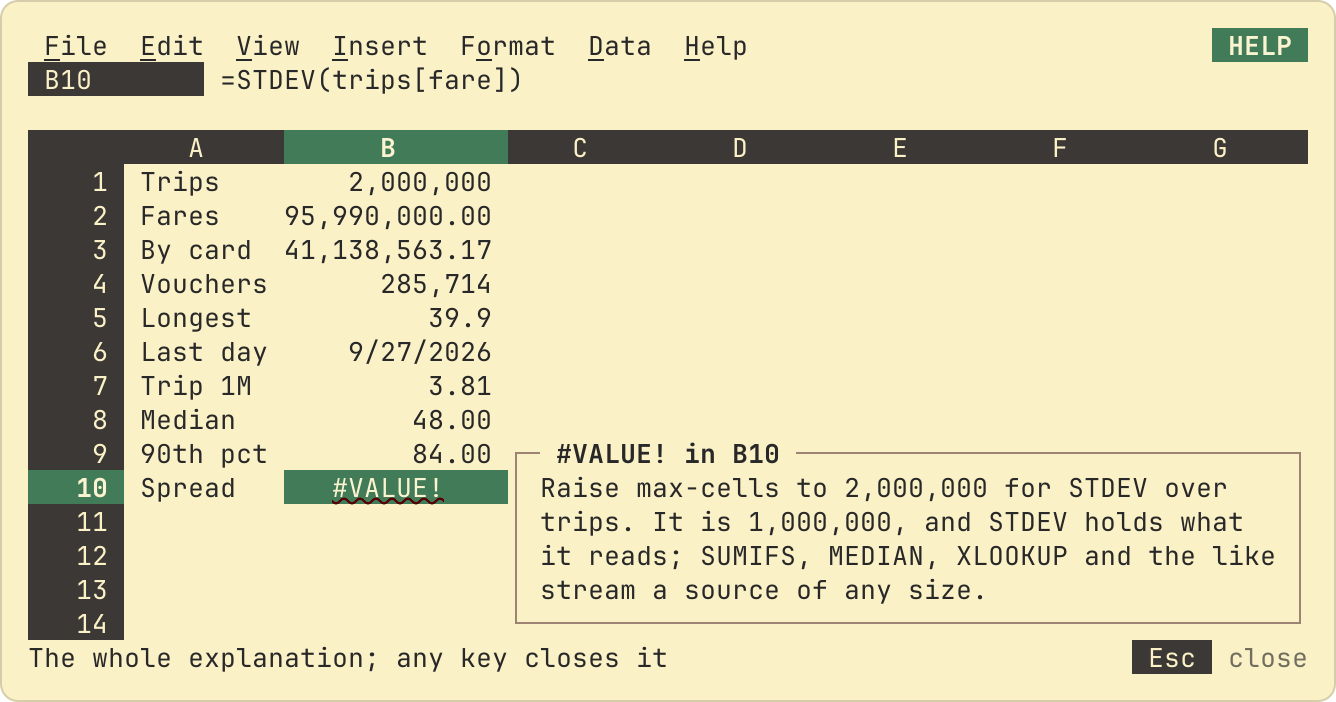
Any other function (STDEV, SORT, FILTER, UNIQUE, TEXTJOIN) holds what
it reads, and is given a source's range as long as that holds no more
than max-cells cells (Configuration);
past it the formula shows #VALUE!. So does an operator over a
source's range (=SUM(sales[amount]*2)) and a function whose other
arguments are ranges of a sheet or arrays:
SUMPRODUCT((sales[cat]="north")*sales[amount]) computes an array as
long as the source, where SUMIFS(sales[amount],sales[cat],"north")
streams. The context line says how far to raise max-cells for it,
and F1 the rest (Values and errors):
Pivot tables
Data > Pivot table on a source's tab makes a
pivot table over the whole source, and Data >
Frequency table (column stats) one of the active column. The source's rows are
grouped in the background, Loading… showing in the pivot table's
first cell until they are, and again whenever the file changes. A
filter of a pivot table over a source takes a condition, not values
ticked.
When the file changes
012 looks at each source's file four times a second, with the
operating system's file information alone. Once the file has changed
and held still for 0.3 s, the source is read again: the tab, and every
formula and pivot table reading it. Data > Linked file > Read the
source again does the same at once. A file that isn't there shows
! after the tab's name and the reason on the context line, and the
formulas reading it show #REF! with it.
Saving and sharing
The workbook keeps the link, never the rows: the file's path relative to the workbook's folder, the table or query, and the tab's order (The .012 format). Opening the workbook reads the sources again. A workbook from another computer asks before reading files outside its own folder, as for linked files.
012 get, recalc and export (Scripts) read the
sources in the workbook's folder or below, to the end, before they
answer. Under 012 serve sources are read in the served folder, and in
a shared workbook the room reads them, as it follows linked
files, while each participant scrolls a tab of their own.
What sources cost, measured on ten million rows, is in Bounds of support.